Wirewalker™
Turbulence Microstructure Measurements from a Wave Powered Profiler
The Wirewalker™ (WW) profiling vehicle, developed by the Ocean Physics Group at the Scripps Institution of Oceanography (SIO), provides a platform for observing oceanographic phenomena that vary rapidly in depth and time. The smooth, “free rising” mode of operation of the WW makes it a suitable platform for the measurement of small scale turbulence. A collaborative attempt between SIO and Rockland to gather estimates of microstructure and the dissipation of turbulent kinetic energy was carried out in the summer of 2012 using a WW and a Rockland MicroRider-1000 turbulence instrument.


The WW platform provided a unique opportunity for Rockland to test the performance of the MicroRider for fast and repetitious autonomous profiles in a single location, observing the time evolution of turbulence features in the water column.
The Wirewalker™ system consists of a positively buoyant vehicle that is driven along a wire by surface waves. The wire is used to suspend a ~10Kg subsurface weight from a surface float (typically 0.5m diameter). The float-wire-subsurface weight assembly moves vertically with surface waves, while a cam mechanism inside the vehicle rectifies that two-way motion into one direction motion (downwards). Once the bottom stop is encountered, the cam mechanism is mechanically disengaged, and the positively buoyant vehicle rises to the surface, completely decoupled from the wire. With this method, high quality ocean turbulence data can be collected on each upcast.
Wirewalker™ with MicroRider-1000 turbulence package
As the Wirewalker™ is a completely mechanical design, it has proven to be a robust and reliable profiler. Compared to buoyancy-controlled floats and gliders, which have limited payload capacity, the WW only requires rough ballasting and can rapidly accommodate large and complex payloads. Equally capable in drifting and moored modes, WWs have been deployed extensively in the Eastern Pacific, Equatorial, Indian and South Atlantic Oceans, carrying CTDs, oxygen sensors, fluorometers, current meters and turbulence sensor packages. For example, an array of three WW units was deployed for 60 days in 50m depth off the South African coast, where the array collected over 100,000 profiles. This is equivalent to over 6,000 km travelled of profile data. Given a low to moderate sea state, a WW will complete a round trip to 50 m in approximately six minutes, with vertical resolution <5 cm.
Wirewalker™ turbulence profiler deployment example
A MicroRider and Nortek 2MHz Aquadopp current meter were mounted on one of the WW rails, with the microstructure sensors roughly 20cm above the WW’s leading edge. A Seabird 49 Fastcat CTD, Turner Designs Cyclops 7 chlorophyll-a fluorometer, and a data logger were mounted on the opposite rail. A fin was also rail mounted in order to align the microstructure sensors into the ambient flow. The combination of rail-mounted vane and rail mount location ensured the microstructure sensors were sampling water undisturbed by the WW wake.
The MR draws ~1W of power during operation, which was supplied by the data acquisition system on the WW. MicroRider data was recorded internally; the WW data logger recorded from all other sensors. The MicroRider also has available analog inputs to allow for synchronized logging of data from additional sensors. 9-18 VDC power can also be provided directly from an available battery pack to the MicroRider.
The Wirewalker™ turbulence profiler system was tested over two deployments in 30 m of water in La Jolla Cove, CA. Each deployment was 3.5 days in duration. Round trip of each profile from the surface to 25m depth was approximately 3.5 minutes, which provided over 1,500 upcast profiles over each deployment (total: 3,102 profiles over seven days).
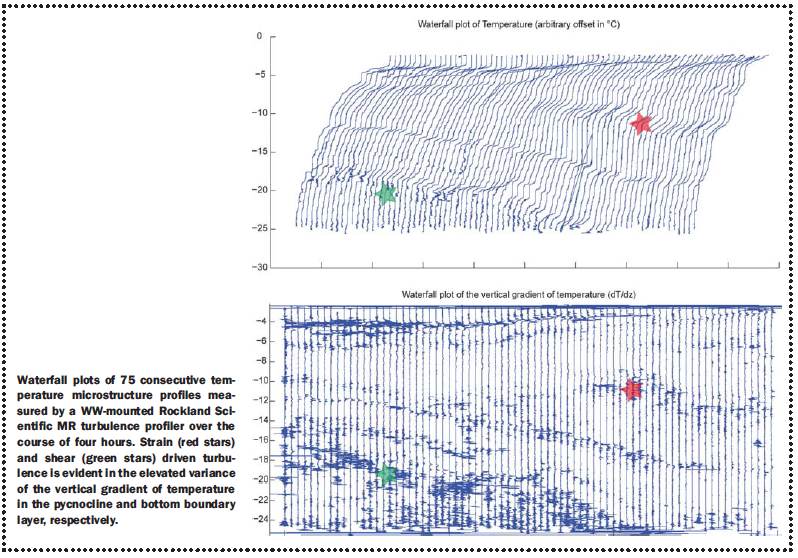
Each upcast resulted in <5 cm vertical resolution throughout the water column of horizontal and vertical currents, density, chlorophyll distribution, and <1 cm vertical resolution in microstructure temperature and turbulence. An example of the microstructure temperature data in a waterfall plot is featured below.
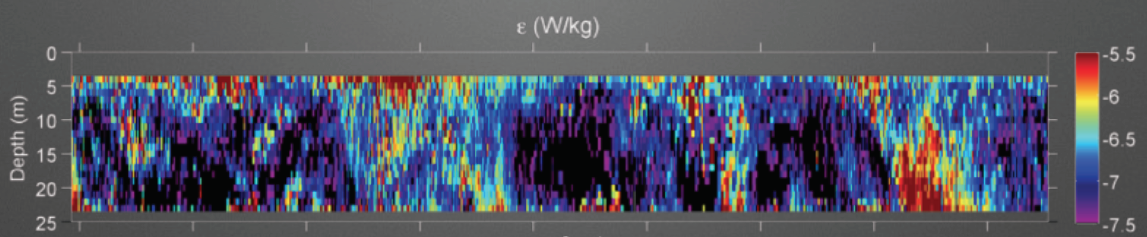
Here is some additional data courtesy of Dr. Andrew J. Lucas, which demonstrates estimations of turbulent kinetic energy dissipation rate over 10 profiles (~3-7 min per profile) at 25m depth.
The Wirewalker™ turbulence profiler system proved effective at measuring shear and temperature microstructure, and estimating the dissipation of turbulence kinetic energy. The study area was subject to strong internal wave forcing. With the MicroRider-Wirewalker™ pair, the researcher, Dr. Andrew Lucas, was able to observe regions of enhanced mixing in the bottom boundary layer, at the base of the thermocline, where current shear was at a maximum and in regions undergoing internal wave induced strain. These data demonstrate the utility of the Wirewalker™ turbulence profiler to observe the evolution of mixing and turbulent features in a temporally and spatial resolved sense.
Further experiments with the MicroRider and Wirewalker™ have used the platform to study the dynamics of mixing in systems where dissipative processes are unsteady in space and time, and where the detailed distribution of mixing, the dissipation of turbulent kinetic energy and fluxes of momentum and buoyancy are required.
Where to acquire the Wirewalker™ platform
The Wirewalker™ was developed by the Ocean Physics Group, Scripps Institution of Oceanography, La Jolla CA, under sponsorship from the Office of Naval Research and National Science Foundation. After extended development, the Wirewalker™ is now produced commercially by Del Mar Oceanographic, LLC., under exclusive license from the University of California. Please visit www.delmarocean.com for further technical and commercial information.